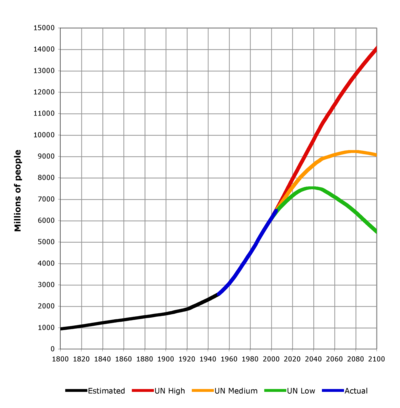
World population from 1800 to 2100, based on UN 2004 projections (red, orange, green) and US Census Bureau historical estimates (black).
*Population By Region
*Population History
| Home | Menu | Poem | Jokes | Games | Biography | Omss বাংলা | Celibrity Video | Dictionary |

|
World Population Day |
A dramatic population bottleneck is theorized for the period around 70,000 BC (see Toba catastrophe theory). After this time and until the development of agriculture, it is estimated that the world population stabilized at about one million people whose subsistence entailed hunting and foraging, a lifestyle that by its nature ensured a low population density. The total world population probably never exceeded 15 million inhabitants before the invention of agriculture. By contrast, it is estimated that more than 55 million people lived in the combined eastern and western Roman Empire (AD 300–400).
The Plague of Justinian caused Europe's population to drop by around 50% between 541 and the 8th century. The population of Europe was more than 70 million in 1340. The Black Death pandemic in the 14th century may have reduced the world's population from an estimated 450 million to between 350 and 375 million in 1400. It took roughly 200 years for Europe's population to regain its 1340 level. China experienced a population decline from an estimated 123 million around 1200 to an estimated 65 million in 1393, which was presumably due to a combination of Mongol invasions and plague. William McNeill clearly states that China's population decline is better explained by bubonic plague than by Mongol ferocity.
At the founding of the Ming Dynasty in 1368, China's population was reported to be close to 60 million, and toward the end of the dynasty in 1644 it might have approached 150 million. England's population reached an estimated 5.6 million in 1650, up from an estimated 2.6 million in 1500. New crops that had come to Asia and Europe from the Americas via the Spanish colonizers in the 16th century contributed to the population growth. Since being introduced by Portuguese traders in the 16th century, maize and manioc have replaced traditional African crops as the continent’s most important staple food crops. Alfred W. Crosby speculated that increased production of maize, manioc, and other American crops "...enabled the slave traders [who] drew many, perhaps most, of their cargoes from the rain forest areas, precisely those areas where American crops enabled heavier settlement than before."
The population of the Americas in 1500 may have been between 50 and 100 million. The pre-Columbian North American population probably numbered somewhere between 2 million and 18 million. Encounters between European explorers and populations in the rest of the world often introduced local epidemics of extraordinary virulence. Archaeological evidence indicates that the death of around 90% of the Native American population of the New World was caused by Old World diseases such as smallpox, measles, and influenza. Over the centuries, the Europeans had developed high degrees of immunity to these diseases, while the indigenous peoples had no such immunity.

During the Agricultural and Industrial Revolutions, the life expectancy of children increased dramatically. The percentage of the children born in London who died before the age of five decreased from 74.5% in 1730-1749 to 31.8% in 1810-1829. Europe’s population increased from about 100 million in 1700 to 400 million by 1900. Altogether, the areas of European settlement comprised 36% of the world's population in 1900.
The population growth became more rapid after the introduction of compulsory vaccination and improvements in medicine and sanitation. As living conditions and health care improved during the 19th century, the United Kingdom's population doubled every fifty years. By 1801 the population of England had grown to 8.3 million, and by 1901 had grown to 30.5 million. The first fifty years of the 20th century in Russia and the Soviet Union were marked by a succession of disasters, each accompanied by large–scale population losses. By 1945, therefore, the population was about 90 million fewer than it could have been otherwise.
The population of the Indian subcontinent, which stood at about 125 million in 1750, had reached 389 million by 1941. Today, the region is home to 1.22 billion people. The total number of inhabitants of Java increased from about five million in 1815 to more than 130 million in the early 21st century. Mexico's population has grown from 13.6 million in 1900 to about 112 million in 2009. In eighty years, Kenya's population has grown from 2.9 million to 37 million.
The scientific consensus is that the current population expansion and accompanying increase in usage of resources is linked to threats to the ecosystem. The InterAcademy Panel Statement on Population Growth, which was ratified by 58 member national academies in 1994, called the growth in human numbers "unprecedented", and stated that many environmental problems, such as rising levels of atmospheric carbon dioxide, global warming, and pollution, were aggravated by the population expansion. At the time, the world population stood at 5.5 billion, and lower-bound scenarios predicted a peak of 7.8 billion by 2050, a number that current estimates show will be reached around 2030.
Human population control is the practice of artificially altering the rate of growth of a human population.
Historically, human population control has been implemented by limiting the population's birth rate, by contraception or by government mandate, and has been undertaken as a response to factors including high or increasing levels of poverty, environmental concerns, religious reasons, and overpopulation.

Rank | Country / Territory | Population | Date | % of world
population | Source |
|---|---|---|---|---|---|
| 1 | 1,345,850,000 | August 22, 2011 | 19.4% | Chinese Official Population Clock | |
| 2 | 1,210,193,422 | March 2011 | 17% | Census of India Organisation | |
| 3 | 312,040,000 | August 22, 2011 | 4.5% | United States Official Population Clock | |
| 4 | 238,400,000 | May 2010 | 3.37% | SuluhNusantara Indonesia Census report | |
| 5 | 195,126,000 | February 22, 2011 | 2.81% | Brazilian Official Population Clock | |
| 6 | 176,999,000 | August 22, 2011 | 2.55% | Official Pakistani Population Clock | |
| 7 | 158,259,000 | 2010 | 2.28% | 2008 UN estimate for year 2010 | |
| 8 | 142,325,250 | 2010 | 2.37% | 2008 UN estimate for year 2010 | |
| 9 | 141,927,297 | January 1, 2010 | 2.05% | Federal State Statistics Service of Russia | |
| 10 | 127,380,000 | June 1, 2010 | 1.84% | Official Japan Statistics Bureau |
Approximately 4.03 billion people live in these ten countries, representing 58.7% of the world's population as of November 2010.

| Rank | Country/Region | Population | Area (km2) | Density
(Pop per km2) | Notes |
|---|---|---|---|---|---|
| 1 | 5,076,700 | 707.1 | 6,535 |
| |
| 2 | 142,325,250 | 147,570 | 1,069 |
| |
| 3 | 1,288,000 | 2040 | 631 |
| |
| 4 | 4,223,760 | 6,020 | 702 |
| |
| 5 | 22,955,395 | 36,190 | 640 |
| |
| 6 | 48,456,369 | 99538 | 487 |
| |
| 7 | 4,224,000 | 10452 | 404 |
| |
| 8 | 16,690,000 | 41,526 | 402 |
| |
| 9 | 9,998,000 | 26338 | 380 |
| |
| 10 | 7,697,600 | 20770 | 371 |
|
| Country | Population | Area (km2) | Density
(Pop. per km2) | Notes |
|---|---|---|---|---|
| 1,202,030,000 | 3,287,240 | 366 | Growing country | |
| 142,325,250 | 143,998 | 1,069 | Fast growing country | |
| 127,170,110 | 377,873 | 337 | Declining in population | |
| 94,013,200 | 300,076 | 313 | Fast growing country | |
| 85,789,573 | 331,689 | 259 | Growing country | |
| 62,041,708 | 243,610 | 255 | Growing country | |
| 49,354,980 | 99,538 | 493 | Steady in population | |
| 22,955,395 | 35,980 | 640 | Steady in population | |
| 20,238,000 | 65,610 | 309 | Growing country | |
| 16,690,000 | 41,526 | 402 | Steady in population |

Different regions have different rates of population growth. According to the above table, the growth in population of the different regions from 2000 to 2005 was:
In the 20th century, the world saw the biggest increase in its population in human history due to lessening of the mortality rate in many countries due to medical advances and massive increase in agricultural productivity attributed to the Green Revolution.
In 2000, the United Nations estimated that the world's population was growing at the rate of 1.14% (or about seventy-five million people) per year, down from a peak of eighty-eight million per year in 1989. In the last few centuries, the number of people living on Earth has increased many times over. By 2000, there were ten times as many people on Earth as there were three hundred years ago. According to data from the CIA's 2005–2006 World Factbooks, the world human population increased by an average of 203,800 people every day. The CIA Factbook increased this to 211,090 people every day in 2007, and again to 220,980 people every day in 2009.

| 7-8 Children 6-7 Children | 5-6 Children 4-5 Children | 3-4 Children 2-3 Children | 1-2 Children 0-1 Children |
Globally, the population growth rate has been steadily declining from its peak of 2.19% in 1963, but growth remains high in Latin America, the Middle East and Sub-Saharan Africa.
In some countries there is negative population growth (i.e. net decrease in population over time), especially in Central and Eastern Europe (mainly due to low fertility rates). Within the next decade, Japan and some countries in Western Europe are also expected to encounter negative population growth due to sub-replacement fertility rates.
In 2006, the United Nations stated that the rate of population growth is diminishing due to the demographic transition. If this trend continues, the rate of growth may diminish to zero, concurrent with a world population plateau of 9.2 billion, in 2050. However, this is only one of many estimates published by the UN. In 2009, UN projections for 2050 range from about 8 billion to 10.5 billion.

Population (est.) 10,000 BC–AD 2000.

Population (est.) 10,000 BC–AD 2000 in log y scale
World population 1950–2000

Increase rate 1950–2000
| Year | UN est
(millions) | Diff. | US est
(millions) | Diff. |
|---|---|---|---|---|
| 2000 | 6,123 | - | 6,090 | - |
| 2010 | 6,896 | 773 | 6,852 | 763 |
| 2020 | 7,657 | 761 | 7,593 | 740 |
| 2030 | 8,321 | 665 | 8,249 | 656 |
| 2040 | 8,874 | 553 | 8,801 | 552 |
| 2050 | 9,306 | 432 | 9,256 | 456 |
In the long run, the future population growth of the world is difficult to predict and the UN and US Census Bureau give different estimates. According to the latter, world population will hit seven billion in July 2012 or by late 2011, according to UN prediction.
Birth rates are declining slightly on average, but vary greatly between developed countries (where birth rates are often at or below replacement levels), developing countries, and different ethnicities. Death rates can change unexpectedly due to disease, wars and catastrophes, or advances in medicine.
The UN has issued multiple projections of future world population, based on different assumptions. Over the last ten years, the UN has consistently revised these projections downward, until the 2006 revision issued March 14, 2007 revised the 2050 mid-range estimate upwards by 273 million.
In some scenarios, disasters triggered by the growing population's demand for scarce resources will eventually lead to a sudden population crash, or even a Malthusian catastrophe (also see overpopulation and food security).
| Year | World | Asia | Africa | Europe | Latin America | Northern America | Oceania |
|---|---|---|---|---|---|---|---|
| 2000 | 6,115 | 3,698 (60.5%) | 819 (13.4%) | 727 (11.9%) | 521 (8.5%) | 319 (5.2%) | 31 (0.5%) |
| 2005 | 6,512 | 3,937 (60.5%) | 921 (14.1%) | 729 (11.2%) | 557 (8.6%) | 335 (5.1%) | 34 (0.5%) |
| 2010 | 6,909 | 4,167 (60.3%) | 1,033 (15.0%) | 733 (10.6%) | 589 (8.5%) | 352 (5.1%) | 36 (0.5%) |
| 2015 | 7,302 | 4,391 (60.1%) | 1,153 (15.8%) | 734 (10.1%) | 618 (8.5%) | 368 (5.0%) | 38 (0.5%) |
| 2020 | 7,675 | 4,596 (59.9%) | 1,276 (16.6%) | 733 (9.6%) | 646 (8.4%) | 383 (5.0%) | 40 (0.5%) |
| 2025 | 8,012 | 4,773 (59.6%) | 1,400 (17.5%) | 729 (9.1%) | 670 (8.4%) | 398 (5.0%) | 43 (0.5%) |
| 2030 | 8,309 | 4,917 (59.2%) | 1,524 (18.3%) | 723 (8.7%) | 690 (8.3%) | 410 (4.9%) | 45 (0.5%) |
| 2035 | 8,571 | 5,032 (58.7%) | 1,647 (19.2%) | 716 (8.4%) | 706 (8.2%) | 421 (4.9%) | 46 (0.5%) |
| 2040 | 8,801 | 5,125 (58.2%) | 1,770 (20.1%) | 708 (8.0%) | 718 (8.2%) | 431 (4.9%) | 48 (0.5%) |
| 2045 | 8,996 | 5,193 (57.7%) | 1,887 (21.0%) | 700 (7.8%) | 726 (8.1%) | 440 (4.9%) | 50 (0.6%) |
| 2050 | 9,150 | 5,231 (57.2%) | 1,998 (21.8%) | 691 (7.6%) | 729 (8.0%) | 448 (4.9%) | 51 (0.6%) |
Below is a table with historical and predicted population figures shown in millions.
The availability of historical population figures varies by region.
| Region | 1500 | 1600 | 1700 | 1750 | 1800 | 1850 | 1900 | 1950 | 1999 | 2008 | 2050 | 2150 |
|---|---|---|---|---|---|---|---|---|---|---|---|---|
| World | 458 | 580 | 682 | 791 | 978 | 1,262 | 1,650 | 2,521 | 5,978 | 6,707 | 8,909 | 9,746 |
| Africa | 86 | 114 | 106 | 106 | 107 | 111 | 133 | 221 | 767 | 973 | 1,766 | 2,308 |
| Asia | 243 | 339 | 436 | 502 | 635 | 809 | 947 | 1,402 | 3,634 | 4,054 | 5,268 | 5,561 |
| Europe | 84 | 111 | 125 | 163 | 203 | 276 | 408 | 547 | 729 | 732 | 628 | 517 |
| Latin America and the Caribbean | 39 | 10 | 10 | 16 | 24 | 38 | 74 | 167 | 511 | 577 | 809 | 912 |
| Northern America | 3 | 3 | 2 | 2 | 7 | 26 | 82 | 172 | 307 | 337 | 392 | 398 |
| Oceania | 3 | 3 | 3 | 2 | 2 | 2 | 6 | 13 | 30 | 34 | 46 | 51 |
| Region | 1500 | 1600 | 1700 | 1750 | 1800 | 1850 | 1900 | 1950 | 1999 | 2008 | 2050 | 2150 |
|---|---|---|---|---|---|---|---|---|---|---|---|---|
| World | 100 | 100 | 100 | 100 | 100 | 100 | 100 | 100 | 100 | 100 | 100 | 100 |
| Africa | 18.8 | 19.7 | 15.5 | 13.4 | 10.9 | 8.8 | 8.1 | 8.8 | 12.8 | 14.5 | 19.8 | 23.7 |
| Asia | 53.1 | 58.4 | 63.9 | 63.5 | 64.9 | 64.1 | 57.4 | 55.6 | 60.8 | 60.4 | 59.1 | 57.1 |
| Europe | 18.3 | 19.1 | 18.3 | 20.6 | 20.8 | 21.9 | 24.7 | 21.7 | 12.2 | 10.9 | 7.0 | 5.3 |
| Latin America and the Caribbean | 8.5 | 1.7 | 1.5 | 2.0 | 2.5 | 3.0 | 4.5 | 6.6 | 8.5 | 8.6 | 9.1 | 9.4 |
| Northern America | 0.7 | 0.5 | 0.3 | 0.3 | 0.7 | 2.1 | 5.0 | 6.8 | 5.1 | 5.0 | 4.4 | 4.1 |
| Oceania | 0.7 | 0.5 | 0.4 | 0.3 | 0.2 | 0.2 | 0.4 | 0.5 | 0.5 | 0.5 | 0.5 | 0.5 |
| Year | World | Africa | Asia | Europe | Latin America | Northern America | Oceania | Notes |
|---|---|---|---|---|---|---|---|---|
| 70,000 BC | < 0.015 |
|
|
|
|
|
|
|
| 10,000 BC | 1 |
|
|
|
|
|
|
|
| 9000 BC | 3 |
|
|
|
|
|
|
|
| 8000 BC | 5 |
|
|
|
|
|
|
|
| 7000 BC | 7 |
|
|
|
|
|
|
|
| 6000 BC | 10 |
|
|
|
|
|
|
|
| 5000 BC | 15 |
|
|
|
|
|
|
|
| 4000 BC | 20 |
|
|
|
|
|
|
|
| 3000 BC | 25 |
|
|
|
|
|
|
|
| 2000 BC | 35 |
|
|
|
|
|
|
|
| 1000 BC | 50 |
|
|
|
|
|
|
|
| 500 BC | 100 |
|
|
|
|
|
|
|
| AD 1 | 200 |
|
|
|
|
|
|
|
| 1000 | 310 |
|
|
|
|
|
|
|
| 1750 | 791 | 106 | 502 | 163 | 16 | 2 | 2 |
|
| 1800 | 978 | 107 | 635 | 203 | 24 | 7 | 2 |
|
| 1850 | 1,262 | 111 | 809 | 276 | 38 | 26 | 2 |
|
| 1900 | 1,650 | 133 | 947 | 408 | 74 | 82 | 6 |
|
| 1950 | 2,519 | 221 | 1,398 | 547 | 167 | 172 | 12.8 |
|
| 1955 | 2,756 | 247 | 1,542 | 575 | 191 | 187 | 14.3 |
|
| 1960 | 2,982 | 277 | 1,674 | 601 | 209 | 204 | 15.9 |
|
| 1965 | 3,335 | 314 | 1,899 | 634 | 250 | 219 | 17.6 |
|
| 1970 | 3,692 | 357 | 2,143 | 656 | 285 | 232 | 19.4 |
|
| 1975 | 4,068 | 408 | 2,397 | 675 | 322 | 243 | 21.5 |
|
| 1980 | 4,435 | 470 | 2,632 | 692 | 361 | 256 | 22.8 |
|
| 1985 | 4,831 | 542 | 2,887 | 706 | 401 | 269 | 24.7 |
|
| 1990 | 5,263 | 622 | 3,168 | 721 | 441 | 283 | 26.7 |
|
| 1995 | 5,674 | 707 | 3,430 | 727 | 481 | 299 | 28.9 |
|
| 2000 | 6,070 | 796 | 3,680 | 728 | 520 | 316 | 31.0 |
|
| 2005 | 6,454 | 888 | 3,917 | 725 | 558 | 332 | 32.9 |
|
| 2008 | 6,707 | 973 | 4,054 | 732 | 577 | 337 | 34.3 |
|
| Year | World | Africa | Asia | Europe | Latin America | Northern America | Oceania | Notes |
The figures for North America only refer to post-European contact settlers, and not native populations from before European settlement.
| Continent name | Density (inhab./km2) | Population (2011) | Most populous country | Most populous city |
|---|---|---|---|---|
| Asia | 86.7 | 4,140,336,501 | ||
| Africa | 32.7 | 994,527,534 | ||
| Europe | 70 | 738,523,843 | London (7,825,200) | |
| North America | 22.9 | 528,720,588 | ||
| South America | 21.4 | 385,742,554 | ||
| Oceania | 4.25 | 36,102,071 | Sydney (4,575,532) | |
| Antarctica | 0 | 3,687 (nonpermanent) | No cities |
Hoerner (1975) proposed a formula for population growth which represented hyperbolic growth with an infinite population in 2025.
According to Kapitsa (1997), the world population grew between 67,000 BC and 1965 according to the formula:

where
The transition from hyperbolic to slower rates of growth is related to the demographic transition.
Using linear interpolation of the UNDESA estimates, the world population has been doubled or will double in the following years (with two different starting points). Note how, during the 2nd millennium, each doubling took roughly half as long as the previous doubling, fitting the hyperbolic growth model mentioned above. However, it is unlikely that there will be another doubling in the current century.

| Population
(in billions) | 0.5 | 1 | 2 | 4 | 8 | |||||
|---|---|---|---|---|---|---|---|---|---|---|
| Year | 1500 | 1804 | 1927 | 1974 | 2025 | |||||
| Years elapsed | 304 | 123 | 47 | 51 | ||||||
| Population
(in billions) | 0.375 | 0.75 | 1.5 | 3 | 6 | |||||
|---|---|---|---|---|---|---|---|---|---|---|
| Year | 1171 | 1715 | 1881 | 1960 | 1999 | |||||
| Years elapsed | 544 | 166 | 79 | 39 | ||||||
The world is made up of thousands of ethnic groups. Han Chinese represent about 19% of the global population.

According to the 2006 CIA World Factbook, around 27% of the world's population is below 15 years of age.
Before adding mortality rates, the 1990s saw the greatest absolute number of births worldwide, especially in the years after 1995, despite the fact that the birth rate was not as high as in the 1960s. In fact, because of the 163 million-per-year births after 1995, the time it took to reach the next billion reached its fastest pace (only twelve years), as world population reached six billion people in 1999; at the beginning of the decade, this figure was only expected to be met in 2000, at the earliest, by most demographers.
1985–1990 marked the period with the fastest yearly population change in world history. Even though the early 1960s had a greater growth rate than in the mid and late 1980s, the population change hovered around eighty-three million people in the five-year period, with an all-time record change of nearly eighty-eight million in 1990. The reason is that the world's population being around 5 billion in the mid- and late-1980s, compared to around 3 billion in the early 1960s, meant that the growth rate (which is a percentage) was not the major factor in the dramatic absolute increase in population.
In 1798, Thomas Malthus incorrectly predicted that population growth would out-run food supply by the mid-19th century. In 1968, Paul R. Ehrlich reprised this argument in The Population Bomb, predicting famine in the 1970s and 1980s. The dire predictions of Ehrlich and other neo-Malthusians were vigorously challenged by a number of economists, notably Julian Lincoln Simon. Agricultural research already under way, such as the Green Revolution, led to dramatic improvements in crop yields. Food production has kept pace with population growth, but Malthusians point out the green revolution relies heavily on petroleum-based fertilizers, and that many crops have become so genetically uniform that a crop failure would be very widespread. Food prices in the early 21st century are rising sharply on a global scale, and causing serious malnutrition to spread widely.

From 1950 to 1984, as the Green Revolution transformed agriculture around the world, grain production increased by over 250%. The world population has grown by about four billion since the beginning of the Green Revolution and most believe that, without the Revolution, there would be greater famine and malnutrition than the UN presently documents (approximately 850 million people suffering from chronic malnutrition in 2005). The energy for the Green Revolution was provided by fossil fuels in the form of fertilizers (natural gas), pesticides (oil), and hydrocarbon-fueled irrigation.
The peaking of world oil production (Peak oil) may test Malthus and Ehrlich critics. As of May 2008, the price of grain had been pushed up by increased farming for use in biofuels, world oil prices at over $140 per barrel ($880/m3), global population growth, climate change, loss of agricultural land to residential and industrial development, and growing consumer demand in China and India. Food riots have recently occurred in some countries across the world. However, oil prices then fell sharply, and remained below $100/barrel for about two years before rising again. Resource demands are expected to ease as population growth declines, but it is unclear whether rising living standards in developing countries will once again create resource shortages.
Richard C. Duncan claims the "world population will decline to about 2 billion circa 2050." David Pimentel, professor of ecology and agriculture at Cornell University, estimates that the sustainable agricultural carrying capacity for the United States is about 200 million people. Growing populations, falling energy sources and food shortages will create the "perfect storm" by 2030, the UK government chief scientist has warned. He said food reserves are at a fifty-year low but the world will require 50% more energy, food and water by 2030. The world will have to produce 70% more food by 2050 to feed a projected extra 2.3 billion people and as incomes rise, the United Nations' Food and Agriculture Organisation (FAO) said.
The observed figures for 2007 show an actual increase in absolute numbers of undernourished people in the world, 923 million in 2007 versus 832 million in 1995.; the more recent FAO estimates point out to an even more dramatic increase, to 1.02 billion in 2009.
Estimates of "the total number of people who have ever lived" published in the first decade of the 21st century range approximately from 100 to 115 billion (1 E11).
An estimate of the total number of people who have ever lived was prepared by Carl Haub of the Population Reference Bureau in 1995 and subsequently updated in 2002; the updated figure was approximately 106 billion. Haub characterized this figure as an estimate that required "selecting population sizes for different points from antiquity to the present and applying assumed birth rates to each period". Given an estimated global population of 6.2 billion in 2002, it could be inferred that about 6% of all people who had ever existed were alive in 2002.
In the 1970s there was a belief that 75% of all the people who had ever lived were alive in the 1970s, which would have put the total number of people who ever lived as of the 1970s as less than the number of people alive today. This view was eventually debunked.
The number is difficult to estimate for the following reasons: