Home | Menu | Poem | Jokes | Games | Biography | Omss বাংলা | Celibrity Video | Dictionary

World Population Day

What is Greenhouse gas ? (2)

Greenhouse gas intensity and land-use change

Greenhouse gas intensity in 2000 including land-use change.

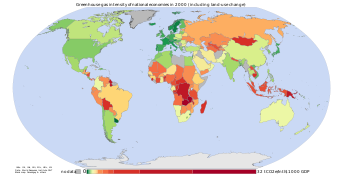
The figure opposite is based on data from the World Resources Institute, and shows a measurement of GHG emissions for the year 2000 according to greenhouse gas intensity and land-use change. Herzog et al. (2006, p. 3) defined greenhouse gas intensity as GHG emissions divided by economic output. GHG intensities are subject to uncertainty over whether they are calculated using market exchange rates (MER) or purchasing power parity (PPP) (Banuri et al., 1996, p. 96). Calculations based on MER suggest large differences in intensities between developed and developing countries, whereas calculations based on PPP show smaller differences.

Land-use change, e.g., the clearing of forests for agricultural use, can affect the concentration of GHGs in the atmosphere by altering how much carbon flows out of the atmosphere into carbon sinks. Accounting for land-use change can be understood as an attempt to measure “net” emissions, i.e., gross emissions from all GHG sources minus the removal of emissions from the atmosphere by carbon sinks (Banuri et al., 1996, pp. 92–93).

There are substantial uncertainties in the measurement of net carbon emissions. Additionally, there is controversy over how carbon sinks should be allocated between different regions and over time (Banuri et al., 1996, p. 93). For instance, concentrating on more recent changes in carbon sinks is likely to favour those regions that have deforested earlier, e.g., Europe.

Cumulative and historical emissions


Top-5 historic CO2 contributors by region over the years 1800 to 1988 (in %)
Region Industrial
CO2
Total
CO2
OECD North America 33.2 29.7
OECD Europe 26.1 16.6
Former USSR 14.1 12.5
China 5.5 6.0
Eastern Europe 5.5 4.8

The table above is based on Banuri et al. (1996, p. 94). Overall, developed countries accounted for 83.8% of industrial CO2 emissions over this time period, and 67.8% of total CO2 emissions. Developing countries accounted for industrial CO2 emissions of 16.2% over this time period, and 32.2% of total CO2 emissions. The estimate of total CO2 emissions includes biotic carbon emissions, mainly from deforestation. Banuri et al. (1996, p. 94) calculated per capita cumulative emissions based on then-current population. The ratio in per capita emissions between industrialized countires and developing countries was estimated to be more than 10 to 1.

Including biotic emissions brings about the same controversy mentioned earlier regarding carbon sinks and land-use change (Banuri et al., 1996, pp. 93–94). The actual calculation of net emissions is very complex, and is affected by how carbon sinks are allocated between regions (an equity consideration), and the dynamics of the climate system.

The International Energy Agency (IEA, 2007, p. 201) compared cumulative energy-related CO2 emissions for several countries and regions. Over the time period 1900-2005, the US accounted for 30% of total cumulative emissions; the EU, 23%; China, 8%; Japan, 4%; and India, 2%. The rest of the world accounted for 33% of global, cumulative, energy-related CO2 emissions.

Changes since a particular base year

In total, Annex I Parties managed a cut of 3.3% in GHG emissions between 1990 and 2004 (UNFCCC, 2007, p. 11). Annex I Parties are those countries listed in Annex I of the UNFCCC, and are the industrialized countries. For non-Annex I Parties, emissions in several large developing countries and fast growing economies (China, India, Thailand, Indonesia, Egypt, and Iran) GHG emissions have increased rapidly over this period (PBL, 2009).

The sharp acceleration in CO2 emissions since 2000 to more than a 3% increase per year (more than 2 ppm per year) from 1.1% per year during the 1990s is attributable to the lapse of formerly declining trends in carbon intensity of both developing and developed nations. China was responsible for most of global growth in emissions during this period. Localised plummeting emissions associated with the collapse of the Soviet Union have been followed by slow emissions growth in this region due to more efficient energy use, made necessary by the increasing proportion of it that is exported. In comparison, methane has not increased appreciably, and N2O by 0.25% y−1.

Annual and per capita emissions

At the present time, total annual emissions of GHGs are rising (Rogner et al., 2007). Between the period 1970 to 2004, emissions increased at an average rate of 1.6% per year, with CO2 emissions from the use of fossil fuels growing at a rate of 1.9% per year.

Today, the stock of carbon in the atmosphere increases by more than 3 million tonnes per annum (0.04%) compared with the existing stock. This increase is the result of human activities by burning fossil fuels, deforestation and forest degradation in tropical and boreal regions.

Per capita emissions in the industrialized countries are typically as much as ten times the average in developing countries (Grubb, 2003, p. 144). Due to China's fast economic development, its per capita emissions are quickly approaching the levels of those in the Annex I group of the Kyoto Protocol (PBL, 2009). Other countries with fast growing emissions are South Korea, Iran, and Australia. On the other hand, per capita emissions of the EU-15 and the USA are gradually decreasing over time. Emissions in Russia and the Ukraine have decreased fastest since 1990 due to economic restructuring in these countries (Carbon Trust, 2009, p. 24).

Energy statistics for fast growing economies are less accurate than those for the industrialized countries. For China's annual emissions in 2008, PBL (2008) estimated an uncertainty range of about 10%.

Top emitters

In 2005, the world's top-20 emitters comprised 80% of total GHG emissions (PBL, 2010. See notes for the following table). Tabulated below are the top-5 emitters for the year 2005 (MNP, 2007). The second column is the country's or region's share of the global total of annual emissions. The third column is the country's or region's average annual per capita emissions, in tonnes of GHG per head of population:
Top-5 emitters for the year 2005
Country or region % of global total
annual emissions
Tonnes of GHG
per capita
United Statesa 16 % 24.1
Indonesiac 6 % 12.9
European Union-27a 11 % 10.6
Chinab 17 % 5.8
India 5 % 2.1

Table footnotes:

  • These values are for the GHG emissions from fossil fuel use and cement production. Calculations are for carbon dioxide (CO2), methane (CH4), nitrous oxide (N2O) and gases containing fluorine (the F-gases HFCs, PFCs and SF6).
  • These estimates are subject to large uncertainties regarding CO2 emissions from deforestation; and the per country emissions of other GHGs (e.g., methane). There are also other large uncertainties which mean that small differences between countries are not significant. CO2 emissions from the decay of remaining biomass after biomass burning/deforestation are not included.
  • a Industrialised countries: official country data reported to UNFCCC.
  • b Excluding underground fires.
c Including an estimate of 2000 million tonnes CO2 from peat fires and decomposition of peat soils after draining. However, the uncertainty range is very large.

Embedded emissions

One way of attributing greenhouse gas (GHG) emissions is to measure the embedded emissions (also referred to as "embodied emissions") of goods that are being consumed. Emissions are usually measured according to production, rather than consumption (Helm et al., 2007, p. 3). Under a production-based accounting of emissions, embedded emissions on imported goods are attributed to the exporting, rather than the importing, country. Under a consumption-based accounting of emissions, embedded emissions on imported goods are attributed to the importing country, rather than the exporting, country.

Davis and Caldeira (2010, p. 4) found that a substantial proportion of CO2 emissions are traded internationally. The net effect of trade was to export emissions from China and other emerging markets to consumers in the US, Japan, and Western Europe. Based on annual emissions data from the year 2004, and on a per-capita consumption basis, the top-5 emitting countries were found to be (in tCO2 per person, per year): Luxembourg (34.7), the US (22.0), Singapore (20.2), Australia (16.7), and Canada (16.6) (Davis and Caldeira, 2010, p. 5).

Effect of policy

Rogner et al. (2007) assessed the effectiveness of policies to reduce emissions (mitigation of climate change). They concluded that mitigation policies undertaken by UNFCCC Parties were inadequate to reverse the trend of increasing GHG emissions. The impacts of population growth, economic development, technological investment, and consumption had overwhelmed improvements in energy intensities and efforts to decarbonize (energy intensity is a country's total primary energy supply (TPES) per unit of GDP (Rogner et al., 2007). TPES is a measure of commercial energy consumption (World Bank, 2010, p. 371)).

Projections


Based on then-current energy policies, Rogner et al. (2007) projected that energy-related CO2 emissions in 2030 would be 40-110% higher than in 2000. Two-thirds of this increase was projected to come from non-Annex I countries. Per capita emissions in Annex I countries were still projected to remain substantially higher than per capita emissions in non-Annex I countries. Projections consistently showed a 25-90% increase in the Kyoto gases (carbon dioxide, methane, nitrous oxide, sulphur hexafluoride) compared to 2000.

IEA (2007, p. 199) estimated future cumulative energy-related CO2 emissions for several countries. Their reference scenario projected cumulative energy-related CO2 emissions between the years 1900 and 2030. In this scenario, China’s share of cumulative emissions rises to 16%, approaching that of the United States (25%) and the European Union (18%). India’s cumulative emissions (4%) approach those of Japan (4%).

Relative CO2 emission from various fuels

One liter of gasoline, when used as a fuel, produces 2.32 kg (1.3 cubic meters) of carbon dioxide, a greenhouse gas. One US gallon produces 19.4 lb (172.65 cubic feet)

Mass of carbon dioxide emitted per quantity of energy for various fuels
Fuel name↓ CO2
emitted
(lbs/106 Btu)↓
CO2
emitted
(g/106 J)↓
Natural gas 117 50.30
Liquefied petroleum gas 139 59.76
Propane 139 59.76
Aviation gasoline 153 65.78
Automobile gasoline 156 67.07
Kerosene 159 68.36
Fuel oil 161 69.22
Tires/tire derived fuel 189 81.26
Wood and wood waste 195 83.83
Coal (bituminous) 205 88.13
Coal (subbituminous) 213 91.57
Coal (lignite) 215 92.43
Petroleum coke 225 96.73
Coal (anthracite) 227 97.59

Removal from the atmosphere and global warming potential

Natural processes


Greenhouse gases can be removed from the atmosphere by various processes, as a consequence of:

  • a physical change (condensation and precipitation remove water vapor from the atmosphere).
  • a chemical reactions within the atmosphere. For example, methane is oxidized by reaction with naturally occurring hydroxyl radical, OH· and degraded to CO2 and water vapor (CO2 from the oxidation of methane is not included in the methane Global warming potential). Other chemical reactions include solution and solid phase chemistry occurring in atmospheric aerosols.
  • a physical exchange between the atmosphere and the other compartments of the planet. An example is the mixing of atmospheric gases into the oceans.
  • a chemical change at the interface between the atmosphere and the other compartments of the planet. This is the case for CO2, which is reduced by photosynthesis of plants, and which, after dissolving in the oceans, reacts to form carbonic acid and bicarbonate and carbonate ions (see ocean acidification).
  • a photochemical change. Halocarbons are dissociated by UV light releasing Cl· and F· as free radicals in the stratosphere with harmful effects on ozone (halocarbons are generally too stable to disappear by chemical reaction in the atmosphere).
Atmospheric lifetime
Aside from water vapor, which has a residence time of about nine days, major greenhouse gases are well-mixed, and take many years to leave the atmosphere. Although it is not easy to know with precision how long it takes greenhouse gases to leave the atmosphere, there are estimates for the principal greenhouse gases. Jacob (1999) defines the lifetime τ of an atmospheric species X in a one-box model as the average time that a molecule of X remains in the box. Mathematically τ can be defined as the ratio of the mass m (in kg) of X in the box to its removal rate, which is the sum of the flow of X out of the box (Fout), chemical loss of X (L), and deposition of X (D) (all in kg/sec): \tau = \frac{m}{F_{out}+L+D} The atmospheric lifetime of a species therefore measures the time required to restore equilibrium following an increase in its concentration in the atmosphere. Individual atoms or molecules may be lost or deposited to sinks such as the soil, the oceans and other waters, or vegetation and other biological systems, reducing the excess to background concentrations. The average time taken to achieve this is the mean lifetime. The atmospheric lifetime of CO2 is often incorrectly stated to be only a few years because that is the average time for any CO2 molecule to stay in the atmosphere before being removed by mixing into the ocean, photosynthesis, or other processes. However, this ignores the balancing fluxes of CO2 into the atmosphere from the other reservoirs. It is the net concentration changes of the various greenhouse gases by all sources and sinks that determines atmospheric lifetime, not just the removal processes.

Global warming potential

The global warming potential (GWP) depends on both the efficiency of the molecule as a greenhouse gas and its atmospheric lifetime. GWP is measured relative to the same mass of CO2 and evaluated for a specific timescale. Thus, if a gas has a high radiative forcing but also a short lifetime, it will have a large GWP on a 20 year scale but a small one on a 100 year scale. Conversely, if a molecule has a longer atmospheric lifetime than CO2 its GWP will increase with the timescale considered.

Carbon dioxide has a variable atmospheric lifetime, and cannot be specified precisely. Recent work indicates that recovery from a large input of atmospheric CO2 from burning fossil fuels will result in an effective lifetime of tens of thousands of years. Carbon dioxide is defined to have a GWP of 1 over all time periods.

Methane has an atmospheric lifetime of 12 ± 3 years and a GWP of 72 over 20 years, 25 over 100 years and 7.6 over 500 years. The decrease in GWP at longer times is because methane is degraded to water and CO2 through chemical reactions in the atmosphere.

Examples of the atmospheric lifetime and GWP relative to CO2 for several greenhouse gases are given in the following table:

Atmospheric lifetime and GWP relative to CO2 at different time horizon for various greenhouse gases.
Gas name Chemical
formula
Lifetime
(years)
Global warming potential (GWP) for given time horizon
20-yr 100-yr 500-yr
Carbon dioxide CO2 See above 1 1 1
Methane CH4 12 72 25 7.6
Nitrous oxide N2O 114 289 298 153
CFC-12 CCl2F2 100 11 000 10 900 5 200
HCFC-22 CHClF2 12 5 160 1 810 549
Tetrafluoromethane CF4 50 000 5 210 7 390 11 200
Hexafluoroethane C2F6 10 000 8 630 12 200 18 200
Sulphur hexafluoride SF6 3 200 16 300 22 800 32 600
Nitrogen trifluoride NF3 740 12 300 17 200 20 700
The use of CFC-12 (except some essential uses) has been phased out due to its ozone depleting properties. The phasing-out of less active HCFC-compounds will be completed in 2030.

Airborne fraction

Airborne fraction (AF) is the proportion of an emission (e.g. CO2) remaining in the atmosphere after a specified time. Canadell (2007) define the annual AF as the ratio of the atmospheric CO2 increase in a given year to that year’s total emissions, and calculate that of the average 9.1 PgC y−1 of total anthropogenic emissions from 2000 to 2006, the AF was 0.45. For CO2 the AF over the last 50 years (1956–2006) has been increasing at 0.25 ± 0.21%/year.

Negative emissions

There exists a number of technologies which produce negative emissions of greenhouse gases. Most widely analysed are those which remove carbon dioxide from the atmosphere, either to geologic formations such as bio-energy with carbon capture and storage and carbon dioxide air capture, or to the soil as in the case with biochar. It has been pointed out by the IPCC, that many long-term climate scenario models require large scale manmade negative emissions in order to avoid serious climate change.

Related effects

Carbon monoxide has an indirect radiative effect by elevating concentrations of methane and tropospheric ozone through scavenging of atmospheric constituents (e.g., the hydroxyl radical, OH) that would otherwise destroy them. Carbon monoxide is created when carbon-containing fuels are burned incompletely. Through natural processes in the atmosphere, it is eventually oxidized to carbon dioxide. Carbon monoxide has an atmospheric lifetime of only a few months and as a consequence is spatially more variable than longer-lived gases.

Another potentially important indirect effect comes from methane, which in addition to its direct radiative impact also contributes to ozone formation. Shindell et al. (2005) argue that the contribution to climate change from methane is at least double previous estimates as a result of this effect.

<

What is Greenhouse gas ?

A greenhouse gas (sometimes abbreviated GHG) is a gas in an atmosphere that absorbs and emits radiation within the thermal infrared range. This process is the fundamental cause of the greenhouse effect. The primary greenhouse gases in the Earth's atmosphere are water vapor, carbon dioxide, methane, nitrous oxide, and ozone. In the Solar System, the atmospheres of Venus, Mars, and Titan also contain gases that cause greenhouse effects. Greenhouse gases greatly affect the temperature of the Earth; without them, Earth's surface would be on average about 33 °C (59 °F) colder than at present.

Since the beginning of the Industrial revolution, the burning of fossil fuels has contributed to the increase in carbon dioxide in the atmosphere from 280ppm to 390ppm.[5][6] Unlike other pollutants, carbon dioxide emissions do not result from inefficient combustion: CO2 is a product of ideal, stoichiometric combustion of carbon. The emissions of carbon are directly proportional to energy consumption.


Greenhouse effects in Earth's atmosphere

In order, the most abundant greenhouse gases in Earth's atmosphere are:

* water vapor
* carbon dioxide
* methane
* nitrous oxide
* ozone
* chlorofluorocarbons

The contribution to the greenhouse effect by a gas is affected by both the characteristics of the gas and its abundance. For example, on a molecule-for-molecule basis methane is about eighty times stronger greenhouse gas than carbon dioxide, but it is present in much smaller concentrations so that its total contribution is smaller. When these gases are ranked by their contribution to the greenhouse effect, the most important are:


Gas | Formula | Contribution(%)

Water vapor H2O 36 – 72 %
Carbon dioxide CO2 9 – 26 %
Methane CH4 4 – 9 %
Ozone O3 3 – 7 %


It is not possible to state that a certain gas causes an exact percentage of the greenhouse effect. This is because some of the gases absorb and emit radiation at the same frequencies as others, so that the total greenhouse effect is not simply the sum of the influence of each gas. The higher ends of the ranges quoted are for each gas alone; the lower ends account for overlaps with the other gases. The major non-gas contributor to the Earth's greenhouse effect, clouds, also absorb and emit infrared radiation and thus have an effect on radiative properties of the greenhouse gases.

In addition to the main greenhouse gases listed above, other greenhouse gases include sulfur hexafluoride, hydrofluorocarbons and perfluorocarbons (see IPCC list of greenhouse gases). Some greenhouse gases are not often listed. For example, nitrogen trifluoride has a high global warming potential (GWP) but is only present in very small quantities.

Although contributing to many other physical and chemical reactions, the major atmospheric constituents, nitrogen (N2), oxygen (O2), and argon (Ar), are not greenhouse gases. This is because molecules containing two atoms of the same element such as N2 and O2 and monatomic molecules such as Ar have no net change in their dipole moment when they vibrate and hence are almost totally unaffected by infrared light. Although molecules containing two atoms of different elements such as carbon monoxide (CO) or hydrogen chloride (HCl) absorb IR, these molecules are short-lived in the atmosphere owing to their reactivity and solubility. As a consequence they do not contribute significantly to the greenhouse effect and are not often included when discussing greenhouse gases. Late 19th century scientists experimentally discovered that N2 and O2 do not absorb infrared radiation (called, at that time, "dark radiation") while, at the contrary, water, as true vapour or condensed in the form of microscopic droplets suspended in clouds, CO2 and other poly-atomic gaseous molecules do absorb infrared radiation. It was recognized in the early 20th century that the greenhouse gases in the atmosphere caused the Earth's overall temperature to be higher than it would be without them. During the late 20th century, a scientific consensus has evolved that increasing concentrations of greenhouse gases in the atmosphere are causing a substantial rise in global temperatures and changes to other parts of the climate system, with consequences for the environment and human health.

Natural and anthropogenic sources

Aside from purely human-produced synthetic halocarbons, most greenhouse gases have both natural and human-caused sources. During the pre-industrial Holocene, concentrations of existing gases were roughly constant. In the industrial era, human activities have added greenhouse gases to the atmosphere, mainly through the burning of fossil fuels and clearing of forests.

The 2007 Fourth Assessment Report compiled by the IPCC (AR4) noted that "changes in atmospheric concentrations of greenhouse gases and aerosols, land cover and solar radiation alter the energy balance of the climate system", and concluded that "increases in anthropogenic greenhouse gas concentrations is very likely to have caused most of the increases in global average temperatures since the mid-20th century". In AR4, "most of" is defined as more than 50%.

Gas Preindustrial level Current level Increase since 1750 Radiative forcing (W/m2)
Carbon dioxide 280 ppm 388 ppm 108 ppm 1.46
Methane 700 ppb 1745 ppb 1045 ppb 0.48
Nitrous oxide 270 ppb 314 ppb 44 ppb 0.15
CFC-12 0 533 ppt 533 ppt 0.17

Ice cores provide evidence for variation in greenhouse gas concentrations over the past 800,000 years. Both CO2 and CH4 vary between glacial and interglacial phases, and concentrations of these gases correlate strongly with temperature. Direct data does not exist for periods earlier than those represented in the ice core record, a record which indicates CO2 mole fractions staying within a range of between 180ppm and 280ppm throughout the last 800,000 years, until the increase of the last 250 years. However, various proxies and modeling suggests larger variations in past epochs; 500 million years ago CO2 levels were likely 10 times higher than now. Indeed higher CO2 concentrations are thought to have prevailed throughout most of the Phanerozoic eon, with concentrations four to six times current concentrations during the Mesozoic era, and ten to fifteen times current concentrations during the early Palaeozoic era until the middle of the Devonian period, about 400 Ma.[17][18][19] The spread of land plants is thought to have reduced CO2 concentrations during the late Devonian, and plant activities as both sources and sinks of CO2 have since been important in providing stabilising feedbacks. Earlier still, a 200-million year period of intermittent, widespread glaciation extending close to the equator (Snowball Earth) appears to have been ended suddenly, about 550 Ma, by a colossal volcanic outgassing which raised the CO2 concentration of the atmosphere abruptly to 12%, about 350 times modern levels, causing extreme greenhouse conditions and carbonate deposition as limestone at the rate of about 1 mm per day. This episode marked the close of the Precambrian eon, and was succeeded by the generally warmer conditions of the Phanerozoic, during which multicellular animal and plant life evolved. No volcanic carbon dioxide emission of comparable scale has occurred since. In the modern era, emissions to the atmosphere from volcanoes are only about 1% of emissions from human sources.

Anthropogenic greenhouse gases

Since about 1750 human activity has increased the concentration of carbon dioxide and other greenhouse gases. Measured atmospheric concentrations of carbon dioxide are currently 100 ppm higher than pre-industrial levels. Natural sources of carbon dioxide are more than 20 times greater than sources due to human activity, but over periods longer than a few years natural sources are closely balanced by natural sinks, mainly photosynthesis of carbon compounds by plants and marine plankton. As a result of this balance, the atmospheric mole fraction of carbon dioxide remained between 260 and 280 parts per million for the 10,000 years between the end of the last glacial maximum and the start of the industrial era.

It is likely that anthropogenic warming, such as that due to elevated greenhouse gas levels, has had a discernible influence on many physical and biological systems. Warming is projected to affect various issues such as freshwater resources, industry, food and health.

The main sources of greenhouse gases due to human activity are:

  • burning of fossil fuels and deforestation leading to higher carbon dioxide concentrations in the air. Land use change (mainly deforestation in the tropics) account for up to one third of total anthropogenic CO2 emissions.
  • livestock enteric fermentation and manure management, paddy rice farming, land use and wetland changes, pipeline losses, and covered vented landfill emissions leading to higher methane atmospheric concentrations. Many of the newer style fully vented septic systems that enhance and target the fermentation process also are sources of atmospheric methane.
  • use of chlorofluorocarbons (CFCs) in refrigeration systems, and use of CFCs and halons in fire suppression systems and manufacturing processes.
  • agricultural activities, including the use of fertilizers, that lead to higher nitrous oxide (N2O) concentrations.

The seven sources of CO2 from fossil fuel combustion are (with percentage contributions for 2000–2004):

Seven main fossil fuel
combustion sources
Contribution
(%)
Liquid fuels (e.g., gasoline, fuel oil) 36 %
Solid fuels (e.g., coal) 35 %
Gaseous fuels (e.g., natural gas) 20 %
Cement production 3 %
Flaring gas industrially and at wells < 1 %
Non-fuel hydrocarbons < 1 %
"International bunker fuels" of transport
not included in national inventories
4 %

The US Environmental Protection Agency (EPA) ranks the major greenhouse gas contributing end-user sectors in the following order: industrial, transportation, residential, commercial and agricultural. Major sources of an individual's greenhouse gas include home heating and cooling, electricity consumption, and transportation. Corresponding conservation measures are improving home building insulation, installing geothermal heat pumps and compact fluorescent lamps, and choosing energy-efficient vehicles.

Carbon dioxide, methane, nitrous oxide and three groups of fluorinated gases (sulfur hexafluoride, HFCs, and PFCs) are the major greenhouse gases and the subject of the Kyoto Protocol, which came into force in 2005.

Although CFCs are greenhouse gases, they are regulated by the Montreal Protocol, which was motivated by CFCs' contribution to ozone depletion rather than by their contribution to global warming. Note that ozone depletion has only a minor role in greenhouse warming though the two processes often are confused in the media.

On December 7, 2009, the US Environmental Protection Agency released its final findings on greenhouse gases, declaring that "greenhouse gases (GHGs) threaten the public health and welfare of the American people". The finding applied to the same "six key well-mixed greenhouse gases" named in the Kyoto Protocol: carbon dioxide, methane, nitrous oxide, hydrofluorocarbons, perfluorocarbons, and sulfur hexafluoride.

Role of water vapor

Water vapor accounts for the largest percentage of the greenhouse effect, between 36% and 66% for clear sky conditions and between 66% and 85% when including clouds. Water vapor concentrations fluctuate regionally, but human activity does not significantly affect water vapor concentrations except at local scales, such as near irrigated fields. The atmospheric concentration of vapor is highly variable, from less than 0.01% in extremely cold regions up to 2% in warm, humid regions.

The average residence time of a water molecule in the atmosphere is only about nine days, compared to years or centuries for other greenhouse gases such as CH4 and CO2. Thus, water vapor responds to and amplifies effects of the other greenhouse gases. The Clausius-Clapeyron relation establishes that air can hold more water vapor per unit volume when it warms. This and other basic principles indicate that warming associated with increased concentrations of the other greenhouse gases also will increase the concentration of water vapor. Because water vapor is a greenhouse gas this results in further warming, a "positive feedback" that amplifies the original warming. This positive feedback does not result in runaway global warming because it is offset by other processes which stabilize average global temperatures.

Greenhouse gas emissions

The two primary sources of CO2 emissions are from burning coal used for electricity generation and petroleum used for motor transport.

Measurements from Antarctic ice cores show that before industrial emissions started atmospheric CO2 mole fractions were about 280 parts per million (ppm), and stayed between 260 and 280 during the preceding ten thousand years. Carbon dioxide mole fractions in the atmosphere have gone up by approximately 35 percent since the 1900s, rising from 280 parts per million by volume to 387 parts per million in 2009. One study using evidence from stomata of fossilized leaves suggests greater variability, with carbon dioxide mole fractions above 300 ppm during the period seven to ten thousand years ago, though others have argued that these findings more likely reflect calibration or contamination problems rather than actual CO2 variability. Because of the way air is trapped in ice (pores in the ice close off slowly to form bubbles deep within the firn) and the time period represented in each ice sample analyzed, these figures represent averages of atmospheric concentrations of up to a few centuries rather than annual or decadal levels.

Since the beginning of the Industrial Revolution, the concentrations of most of the greenhouse gases have increased. For example, the mole fraction of carbon dioxide has increased by about 36% to 380 ppm, or 100 ppm over modern pre-industrial levels. The first 50 ppm increase took place in about 200 years, from the start of the Industrial Revolution to around 1973; however the next 50 ppm increase took place in about 33 years, from 1973 to 2006.

Recent data also shows that the concentration is increasing at a higher rate. In the 1960s, the average annual increase was only 37% of what it was in 2000 through 2007.

The other greenhouse gases produced from human activity show similar increases in both amount and rate of increase. Many observations are available online in a variety of Atmospheric Chemistry Observational Databases.

Relevant to radiative forcing
Gas Current (1998)
Amount by volume
Increase
(absolute, ppm)
over pre-industrial (1750)
Increase
(relative, %)
over pre-industrial (1750)
Radiative
forcing
(W/m2)
Carbon dioxide 365 ppm
(383 ppm, 2007.01)
87 ppm
(105 ppm, 2007.01)
31 %
(38 %, 2007.01)
1.46
(~1.53, 2007.01)
Methane 1745 ppb 1045 ppb 150 % 0.48
Nitrous oxide 314 ppb 44 ppb 16 % 0.15
Relevant to both radiative forcing and ozone depletion; all of the following have no natural sources and hence zero amounts pre-industrial
Gas Current (1998)
Amount by volume
Radiative forcing
(W/m2)
CFC-11 268 ppt 0.07
CFC-12 533 ppt 0.17
CFC-113 84 ppt 0.03
Carbon tetrachloride 102 ppt 0.01
HCFC-22 69 ppt 0.03

Regional and national attribution of emissions

There are several different ways of measuring GHG emissions (see World Bank (2010, p. 362) for a table of national emissions data).

Some variables that have been reported include:

  • Definition of measurement boundaries. Emissions can be attributed geographically, to the area where they were emitted (the territory principle) or by the activity principle to the territory that caused the emissions to be produced. These two principles would result in different totals when measuring for example the importation of electricity from one country to another or the emissions at an international airport.
  • The time horizon of different GHGs. Contribution of a given GHG is reported as a CO2 equivalent; the calculation to determine this takes into account how long that gas remains in the atmosphere. This is not always known accurately and calculations must be regularly updated to take into account new information.
  • What sectors are included in the calculation (e.g. energy industries, industrical processes, agriculture etc.). There is often a conflict between transparency and availability of data.
  • The measurement protocol itself. This may be via direct measurement or estimation; the four main methods are the emission factor-based method, the mass balance method, the predictive emissions monitoring system and the continuing emissions monitoring systems. The methods differ in accuracy, but also in cost and usability.

The different measures are sometimes used by different countries in asserting various policy/ethical positions to do with climate change (Banuri et al., 1996, p. 94). This use of different measures leads to a lack of comparability, which is problematic when monitoring progress towards targets. There are arguments for the adoption of a common measurement tool, or at least the development of communication between different tools.

Emissions may be measured over long time periods. This measurement type is called historical or cumulative emissions. Cumulative emissions give some indication of who is responsible for the build-up in the atmospheric concentration of GHGs (IEA, 2007, p. 199).

Emissions may also be measured across shorter time periods. Emissions changes may, for example, be measured against a base year of 1990. 1990 was used in the United Nations Framework Convention on Climate Change (UNFCCC) as the base year for emissions, and is also used in the Kyoto Protocol (some gases are also measured from the year 1995) (Grubb, 2003, pp. 146, 149). A country's emissions may also be reported as a proportion of global emissions for a particular year.

Another measurement is of per capita emissions. This divides a country's total annual emissions by its mid-year population (World Bank, 2010, p. 370). Per capita emissions may be based on historical or annual emissions (Banuri et al., 1996, pp. 106–107).

Next Page>>


Greenhouse Effect Is Our Big Problem

A representation of the exchanges of energy between the source (the Sun), the Earth's surface, the Earth's atmosphere, and the ultimate sink outer space. The ability of the atmosphere to capture and recycle energy emitted by the Earth surface is the defining characteristic of the greenhouse effect.

The greenhouse effect is a process by which thermal radiation from a planetary surface is absorbed by atmospheric greenhouse gases, and is re-radiated in all directions. Since part of this re-radiation is back towards the surface, energy is transferred to the surface and the lower atmosphere. As a result, the temperature there is higher than it would be if direct heating by solar radiation were the only warming mechanism.

This mechanism is fundamentally different from that of an actual greenhouse, which works by isolating warm air inside the structure so that heat is not lost by convection.

The greenhouse effect was discovered by Joseph Fourier in 1824, first reliably experimented on by John Tyndall in 1858, and first reported quantitatively by Svante Arrhenius in 1896.

If an ideal thermally conductive blackbody was the same distance from the Sun as the Earth is, it would have a temperature of about 5.3 °C. However, since the Earth reflects about 30% (or 28%) of the incoming sunlight, the planet's effective temperature (the temperature of a blackbody that would emit the same amount of radiation) is about −18 or −19 °C, about 33°C below the actual surface temperature of about 14 °C or 15 °C. The mechanism that produces this difference between the actual surface temperature and the effective temperature is due to the atmosphere and is known as the greenhouse effect.

Global warming, a recent warming of the Earth's surface and lower atmosphere, is believed to be the result of a strengthening of the greenhouse effect mostly due to human-produced increases in atmospheric greenhouse gases.

Basic mechanism

The Earth receives energy from the Sun in the form UV, visible, and near IR radiation, most of which passes through the atmosphere without being absorbed. Of the total amount of energy available at the top of the atmosphere (TOA), about 50% is absorbed at the Earth's surface. Because it is warm, the surface radiates far IR thermal radiation that consists of wavelengths that are predominantly much longer than the wavelengths that were absorbed. Most of this thermal radiation is absorbed by the atmosphere and re-radiated both upwards and downwards; that radiated downwards is absorbed by the Earth's surface. This trapping of long-wavelength thermal radiation leads to a higher equilibrium temperature than if the atmosphere were absent.

This highly simplified picture of the basic mechanism needs to be qualified in a number of ways, none of which affect the fundamental process.

* The incoming radiation from the Sun is mostly in the form of visible light and nearby wavelengths, largely in the range 0.2–4 μm, corresponding to the Sun's radiative temperature of 6,000 K.[11] Almost half the radiation is in the form of "visible" light, which our eyes are adapted to use.[12]
* About 50% of the Sun's energy is absorbed at the Earth's surface and the rest is reflected or absorbed by the atmosphere. The reflection of light back into space—largely by clouds—does not much affect the basic mechanism; this light, effectively, is lost to the system.
* The absorbed energy warms the surface. Simple presentations of the greenhouse effect, such as the idealized greenhouse model, show this heat being lost as thermal radiation. The reality is more complex: the atmosphere near the surface is largely opaque to thermal radiation (with important exceptions for "window" bands), and most heat loss from the surface is by sensible heat and latent heat transport. Radiative energy losses become increasingly important higher in the atmosphere largely because of the decreasing concentration of water vapor, an important greenhouse gas. It is more realistic to think of the greenhouse effect as applying to a "surface" in the mid-troposphere, which is effectively coupled to the surface by a lapse rate.
* Within the region where radiative effects are important the description given by the idealized greenhouse model becomes realistic: The surface of the Earth, warmed to a temperature around 255 K, radiates long-wavelength, infrared heat in the range 4–100 μm.[11] At these wavelengths, greenhouse gases that were largely transparent to incoming solar radiation are more absorbent.[11] Each layer of atmosphere with greenhouses gases absorbs some of the heat being radiated upwards from lower layers. To maintain its own equilibrium, it re-radiates the absorbed heat in all directions, both upwards and downwards. This results in more warmth below, while still radiating enough heat back out into deep space from the upper layers to maintain overall thermal equilibrium. Increasing the concentration of the gases increases the amount of absorption and re-radiation, and thereby further warms the layers and ultimately the surface below.[7]
* Greenhouse gases—including most diatomic gases with two different atoms (such as carbon monoxide, CO) and all gases with three or more atoms—are able to absorb and emit infrared radiation. Though more than 99% of the dry atmosphere is IR transparent (because the main constituents—N2, O2, and Ar—are not able to directly absorb or emit infrared radiation), intermolecular collisions cause the energy absorbed and emitted by the greenhouse gases to be shared with the other, non-IR-active, gases.
* The simple picture assumes equilibrium. In the real world there is the diurnal cycle as well as seasonal cycles and weather. Solar heating only applies during daytime. During the night, the atmosphere cools somewhat, but not greatly, because its emissivity is low, and during the day the atmosphere warms. Diurnal temperature changes decrease with height in the atmosphere.

Greenhouse gases

By their percentage contribution to the greenhouse effect on Earth the four major gases are:

* water vapor, 36–70%
* carbon dioxide, 9–26%
* methane, 4–9%
* ozone, 3–7%

The major non-gas contributor to the Earth's greenhouse effect, clouds, also absorb and emit infrared radiation and thus have an effect on radiative properties of the atmosphere.


Role in climate change

Strengthening of the greenhouse effect through human activities is known as the enhanced (or anthropogenic) greenhouse effect. This increase in radiative forcing from human activity is attributable mainly to increased atmospheric carbon dioxide levels.

CO2 is produced by fossil fuel burning and other activities such as cement production and tropical deforestation. Measurements of CO2 from the Mauna Loa observatory show that concentrations have increased from about 313 ppm in 1960 to about 389 ppm in 2010. The current observed amount of CO2 exceeds the geological record maxima (~300 ppm) from ice core data. The effect of combustion-produced carbon dioxide on the global climate, a special case of the greenhouse effect first described in 1896 by Svante Arrhenius, has also been called the Callendar effect.

Because it is a greenhouse gas, elevated CO2 levels contribute to additional absorption and emission of thermal infrared in the atmosphere, which produce net warming. According to the latest Assessment Report from the Intergovernmental Panel on Climate Change, "most of the observed increase in globally averaged temperatures since the mid-20th century is very likely due to the observed increase in anthropogenic greenhouse gas concentrations".

Over the past 800,000 years, ice core data shows unambiguously that carbon dioxide has varied from values as low as 180 parts per million (ppm) to the pre-industrial level of 270ppm. Paleoclimatologists consider variations in carbon dioxide to be a fundamental factor in controlling climate variations over this time scale.


Real greenhouses

The "greenhouse effect" is named by analogy to greenhouses. The greenhouse effect and a real greenhouse are similar in that they both limit the rate of thermal energy flowing out of the system, but the mechanisms by which heat is retained are different. A greenhouse works primarily by preventing absorbed heat from leaving the structure through convection, i.e. sensible heat transport. The greenhouse effect heats the earth because greenhouse gases absorb outgoing radiative energy and re-emit some of it back towards earth.

A greenhouse is built of any material that passes sunlight, usually glass, or plastic. It mainly heats up because the Sun warms the ground inside, which then warms the air in the greenhouse. The air continues to heat because it is confined within the greenhouse, unlike the environment outside the greenhouse where warm air near the surface rises and mixes with cooler air aloft. This can be demonstrated by opening a small window near the roof of a greenhouse: the temperature will drop considerably. It has also been demonstrated experimentally (R. W. Wood, 1909) that a "greenhouse" with a cover of rock salt (which is transparent to infra red) heats up an enclosure similarly to one with a glass cover. Thus greenhouses work primarily by preventing convective cooling.

In the greenhouse effect, rather than retaining (sensible) heat by physically preventing movement of the air, greenhouse gases act to warm the Earth by re-radiating some of the energy back towards the surface. This process may exist in real greenhouses, but is comparatively unimportant there.

Bodies other than Earth

In our solar system, Mars, Venus, and the moon Titan also exhibit greenhouse effects. Titan has an anti-greenhouse effect, in that its atmosphere absorbs solar radiation but is relatively transparent to infrared radiation. Pluto also exhibits behavior superficially similar to the anti-greenhouse effect.

A runaway greenhouse effect occurs if positive feedbacks lead to the evaporation of all greenhouse gases into the atmosphere. A runaway greenhouse effect involving carbon dioxide and water vapor is thought to have occurred on Venus.

5 June World Enviroment Day

World Environment Day (WED) is a day that stimulates awareness of the environment and enhances political attention and public action. It is on 5 June. It was the day that United Nations Conference on the Human Environment began. The United Nations Conference on the Human Environment was from 5–16 June 1972. It was established by the United Nations General Assembly in 1972. The first World Environment Day was on 1973. World Environment Day is hosted every year by a different city with a different theme and is commemorated with an international exposition in the week of 5 June. World Environment Day is in summer in the Northern Hemisphere and winter in the Southern Hemisphere.

"Stockholm was without doubt the landmark event in the growth of international environmentalism", writes John McCormick in the book Reclaiming Paradise. "It was the first occasion on which the political, social and economic problems of the global environment were discussed at an intergovernmental forum with a view to actually taking corrective action."

World Environment Day is similar to Earth Day.